#ivoted – Foursquare, Google, JESS3 Make Voting Social
![]() Time’s running out to prepare for The Big Checkin. As you might be aware Foursquare has launched its “I Voted” campaign with a goal of illustrating in real time where you are voting and when (or at least checking in) – it all starts November 2. And of course there’s a badge (#ivoted).
Time’s running out to prepare for The Big Checkin. As you might be aware Foursquare has launched its “I Voted” campaign with a goal of illustrating in real time where you are voting and when (or at least checking in) – it all starts November 2. And of course there’s a badge (#ivoted).
According to Foursquare the I Voted data visualization and badge are designed with three purposes in mind:
- To encourage civic participation
- Increase transparency in the voting process
- Develop a replicatable system for the 2012 Presidential Election [that’s quite an ambition!]
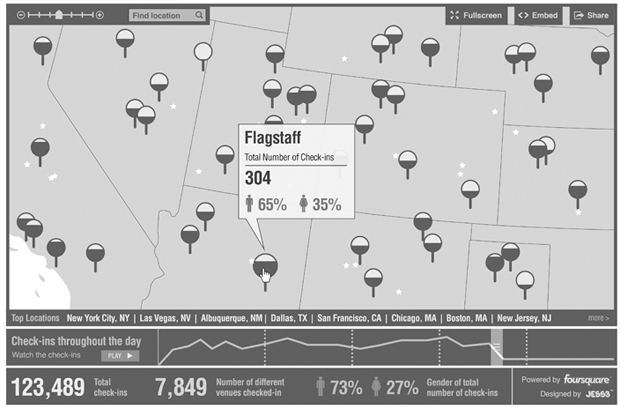
The, uh, campaign was created as a collaboration with Rock the Vote, the Pew Center, and Google (and others), and will provide some level of insight into Foursquare’s 4,000,000+- users, including how many of them checkin in at a voting center along with a gender breakdown.
 The especially nice thing about this project is a planned presentation of the realtime checkin data created by the d-visualization magicians at JESS3. Expect to see the map lighting up with activity like the power grid during a nationwide heat wave. Should be interesting.

Will it inform us of anything related to voting behaviors or inclinations? That remains to be seen. More interesting might have been what we did at AOL some time back, which was to source the crowd for their intentions via online polling and display that on a map with live updating – all in advance of the big day.
Still, geosocial activity around major events is in its infancy and it will be fun to watch the evolution as creative developers and thinkers find ways to make data and location features that define the present and not that recent past, and — most interesting — features that define or predict the future.
By the way, Gowalla has “gone to the polls” in their own way.
This post originally appeared on Locl.ly.